HomeLiberty Blog

Monday, August 19, 2013


30-Year Fixed Rate Mortgage Average in the United States

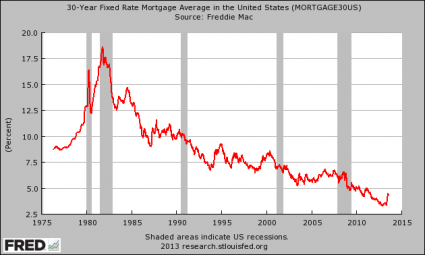
Some interesting charts to review.  Take a look at the spike at the end of each graph. 
Posted by Unknown at 11:26 AM
Email ThisBlogThis!Share to XShare to FacebookShare to Pinterest

No comments:

Post a Comment

Newer Post Older Post Home
Subscribe to: Post Comments (Atom)

Blog Archive

  • ►  2015 (1)
    • ►  February (1)
  • ►  2014 (138)
    • ►  December (2)
    • ►  October (16)
    • ►  September (18)
    • ►  August (18)
    • ►  July (14)
    • ►  June (6)
    • ►  May (9)
    • ►  April (12)
    • ►  March (7)
    • ►  February (16)
    • ►  January (20)
  • ▼  2013 (72)
    • ►  December (14)
    • ►  November (12)
    • ►  October (12)
    • ►  September (21)
    • ▼  August (13)
      • Labor Force Participation Rate 1948-2012
      • B of A To eliminate 1000 Mortgage Jobs- If the mar...
      • Pimco Sees Taper in Worst MBS Slump Since 1999: Cr...
      • Fannie, Freddie Loan Limit Reduction Coming
      • This week has seen a flurry of activity, whose a...
      • New Home Sale Numbers Broken Down
      • Good Morning All.  The Existing Home Sales numbers...
      • Some interesting charts to review.  Take a loo...
      • Cash Purchases Since 2012
      • Foreclosure in Michigan and Nationwide
      • You may have seen a lot of coverage on the recen...
      • The Michigan State Housing Development Authority i...
      • HomeLiberty Moves To Help Michigan Homeowners

About Me

Unknown
View my complete profile
Simple theme. Powered by Blogger.